Course Insights

Course Insights is a Canvas LTI that enables instructors to reflect on data that describes the population of students enrolled in their courses including demographic, majors and minors, semester standing, prior enrollment summaries, and more! Course Insights is a limited access pilot developed by Teaching and Learning with Technology (TLT)’s Data Empowered Learning Team.

The power of course data at your fingertips

Course Insights is a learning analytics pilot developed for instructors to provide timely, actionable insight into course enrollment and student activity. Through this insight, instructors can more effectively:

  • Identify students who may be struggling
  • Plan course materials with a strong understanding of student backgrounds
  • Understand and account for student activity

Course Insights pulls together a variety of information from across the University and displays it in a simple, easily accessible format.  This tool helps instructors understand where students are in their learning, how they are interacting with online course materials, and what courses they take next.  How this learning analytic data can help, ultimately, is up to the instructor. Some of the most common uses of the data provide within Course Insights include:

  • Designing of lessons that account for student demographics, majors and minors, and previously completed courses, etc.
  • Be alerted when a student is significantly less active in the course compared to their peers
  • Plan future lessons based on engagement patterns
  • And much, much more.

Features

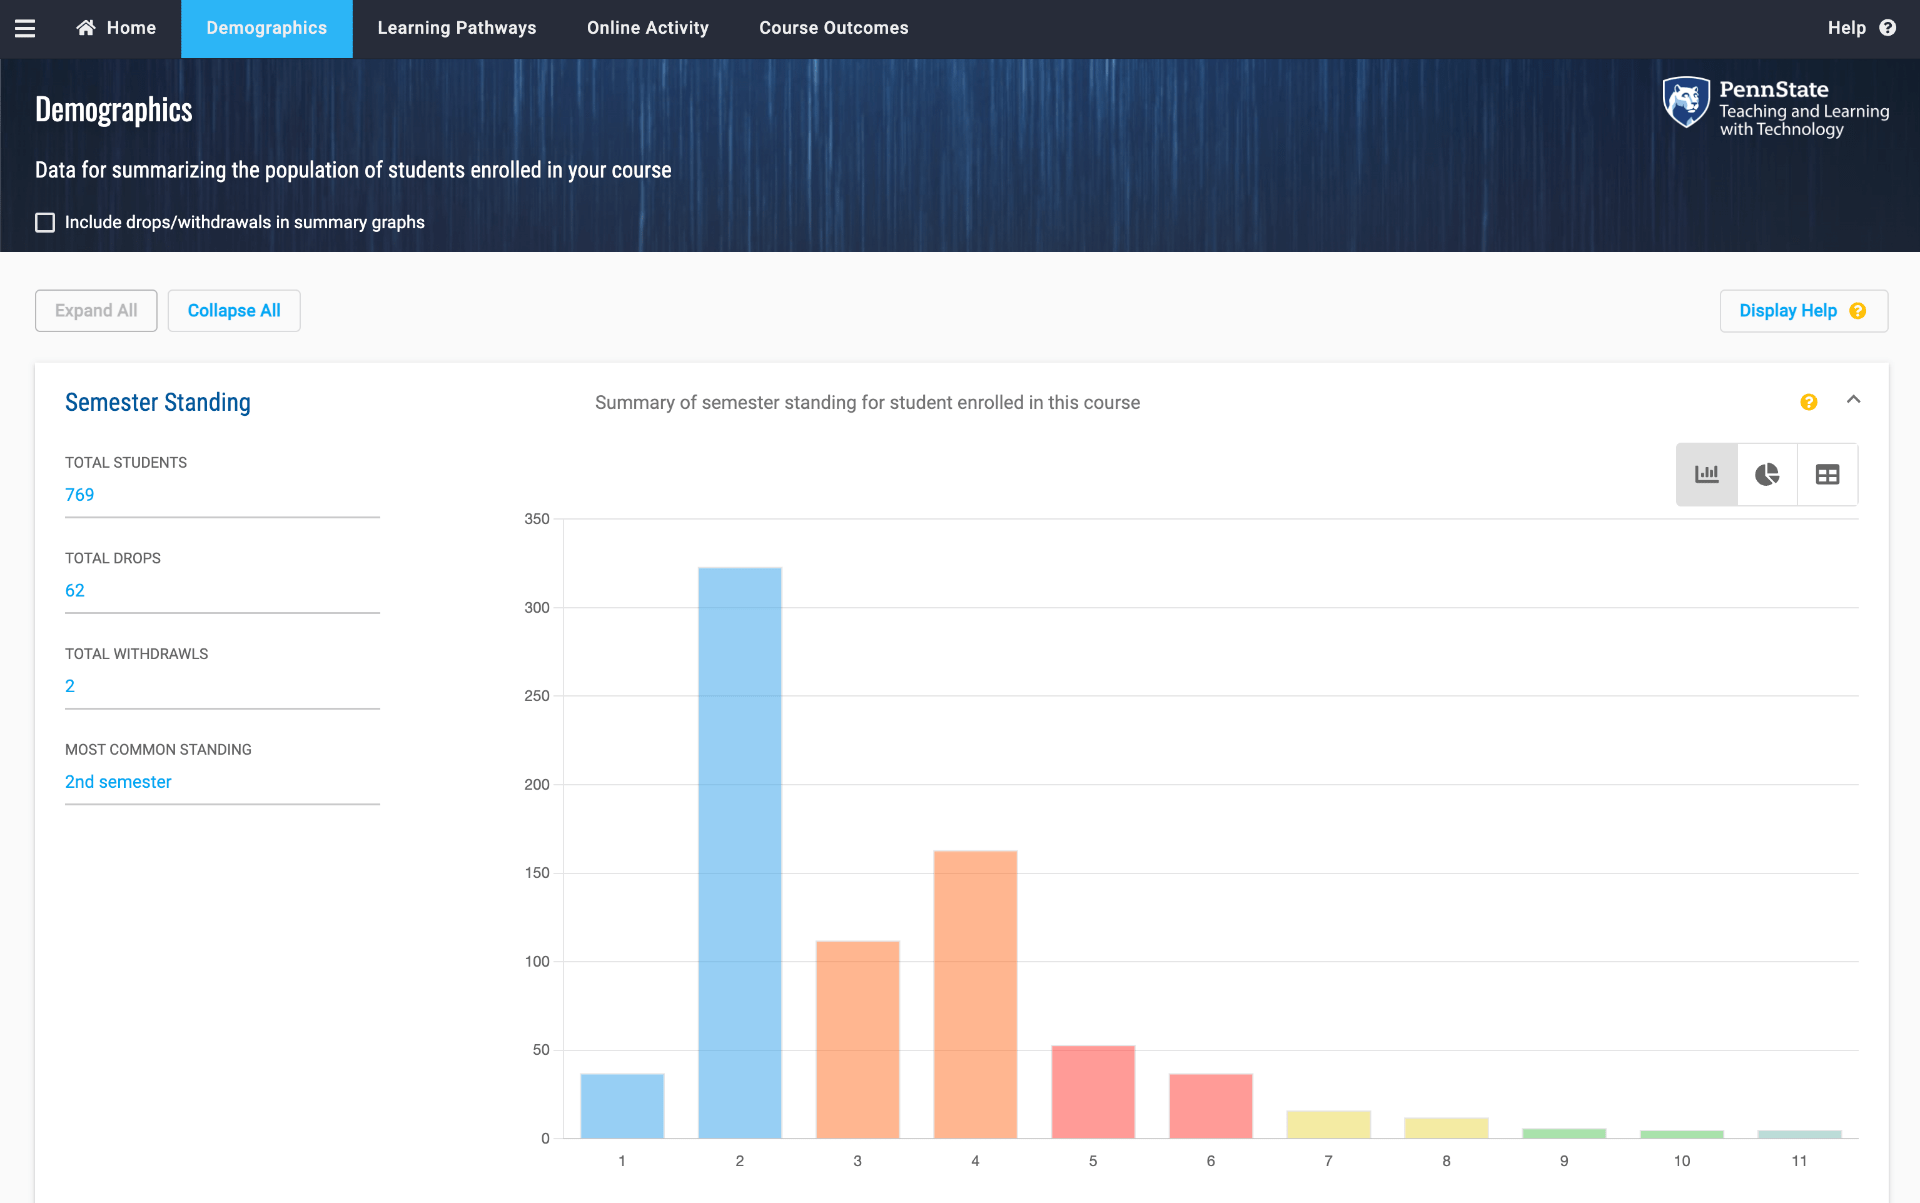
Within Course Insights, demographic data is designed to aggregate information around those students enrolled in any individual section of your course. This aggregated data includes semester standing, cumulative GPA, and the degree programs and plans of your students. Diversity and ethnicity data is also available. Instructors can use this information to inform lesson planning, the creation of learning support materials, or to relate course topics and examples to specific areas of study or interest.
Demographics bar chart
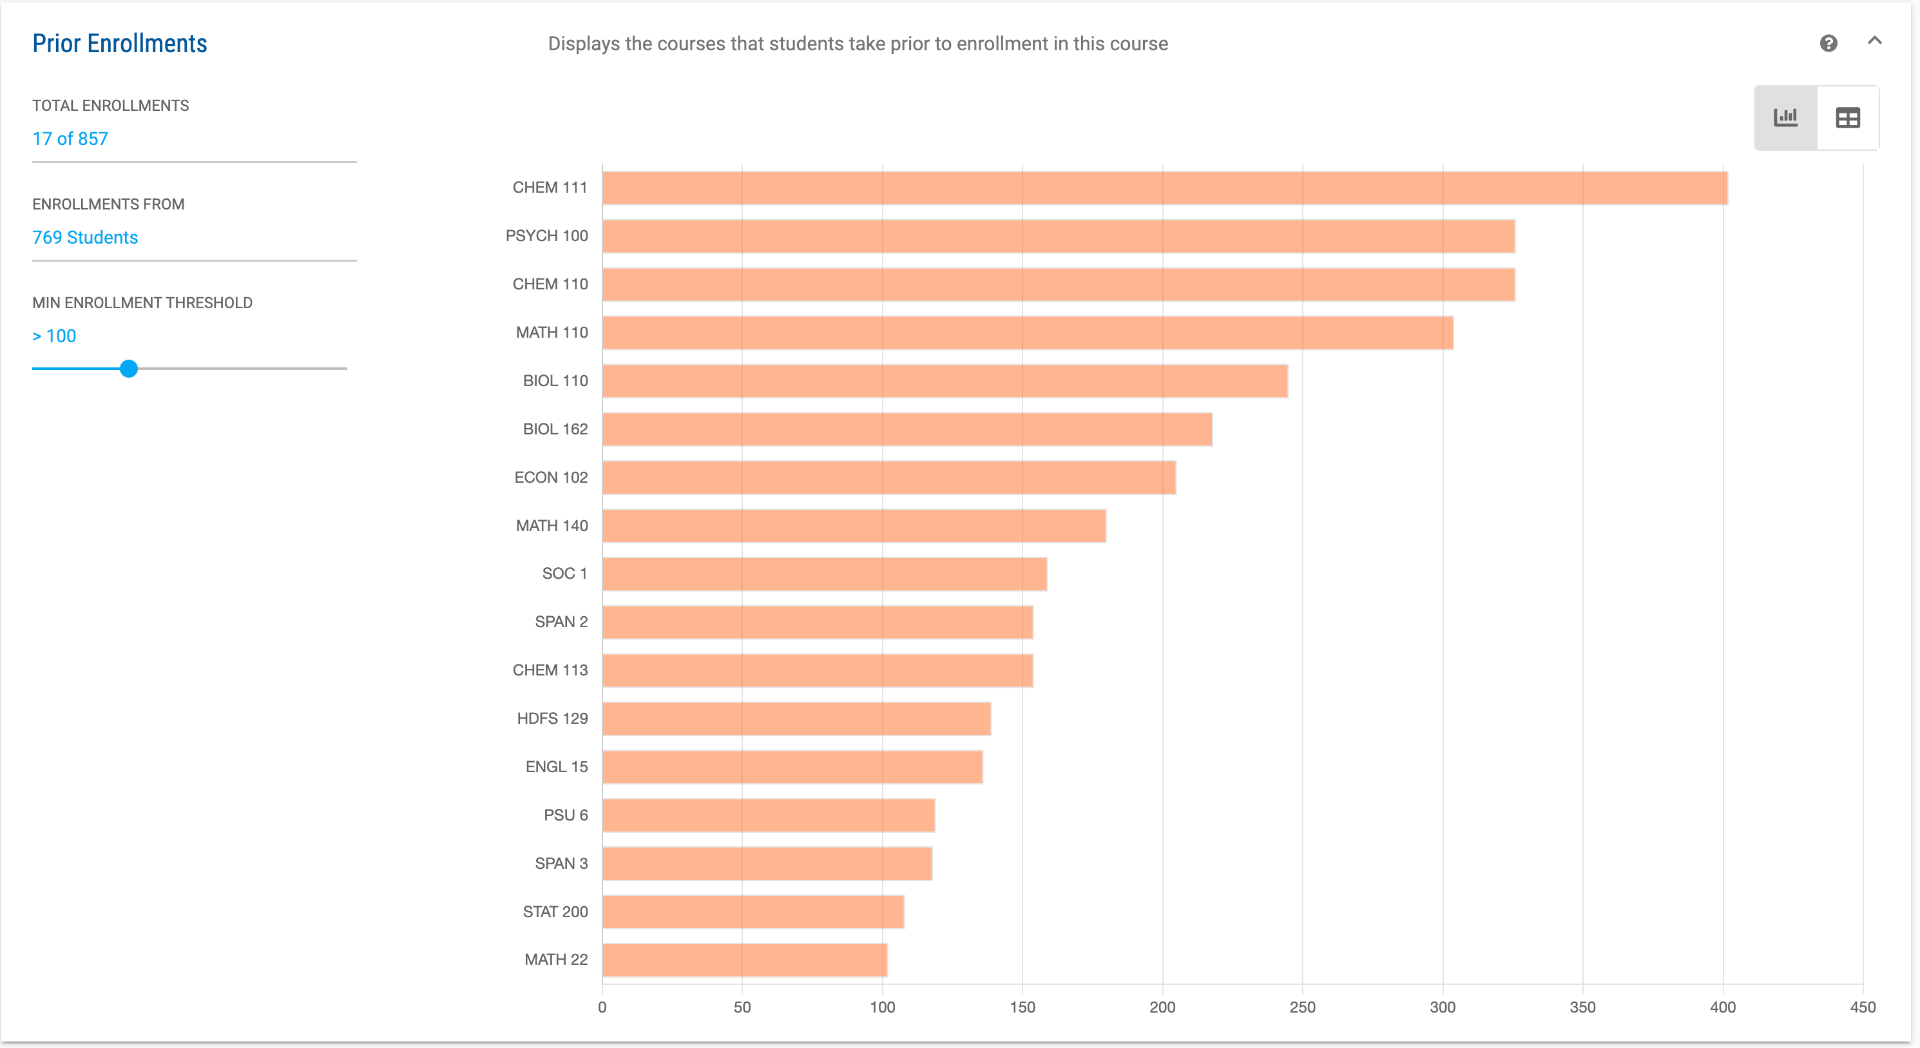
Learning Pathways provides you with aggregate information about your students’ course enrollment history. The goal of this data is to help instructors better understand the history of campus and course enrollments for students in their course, as well as to provide a snapshot of current course enrollments.
Enrollment history bar chart
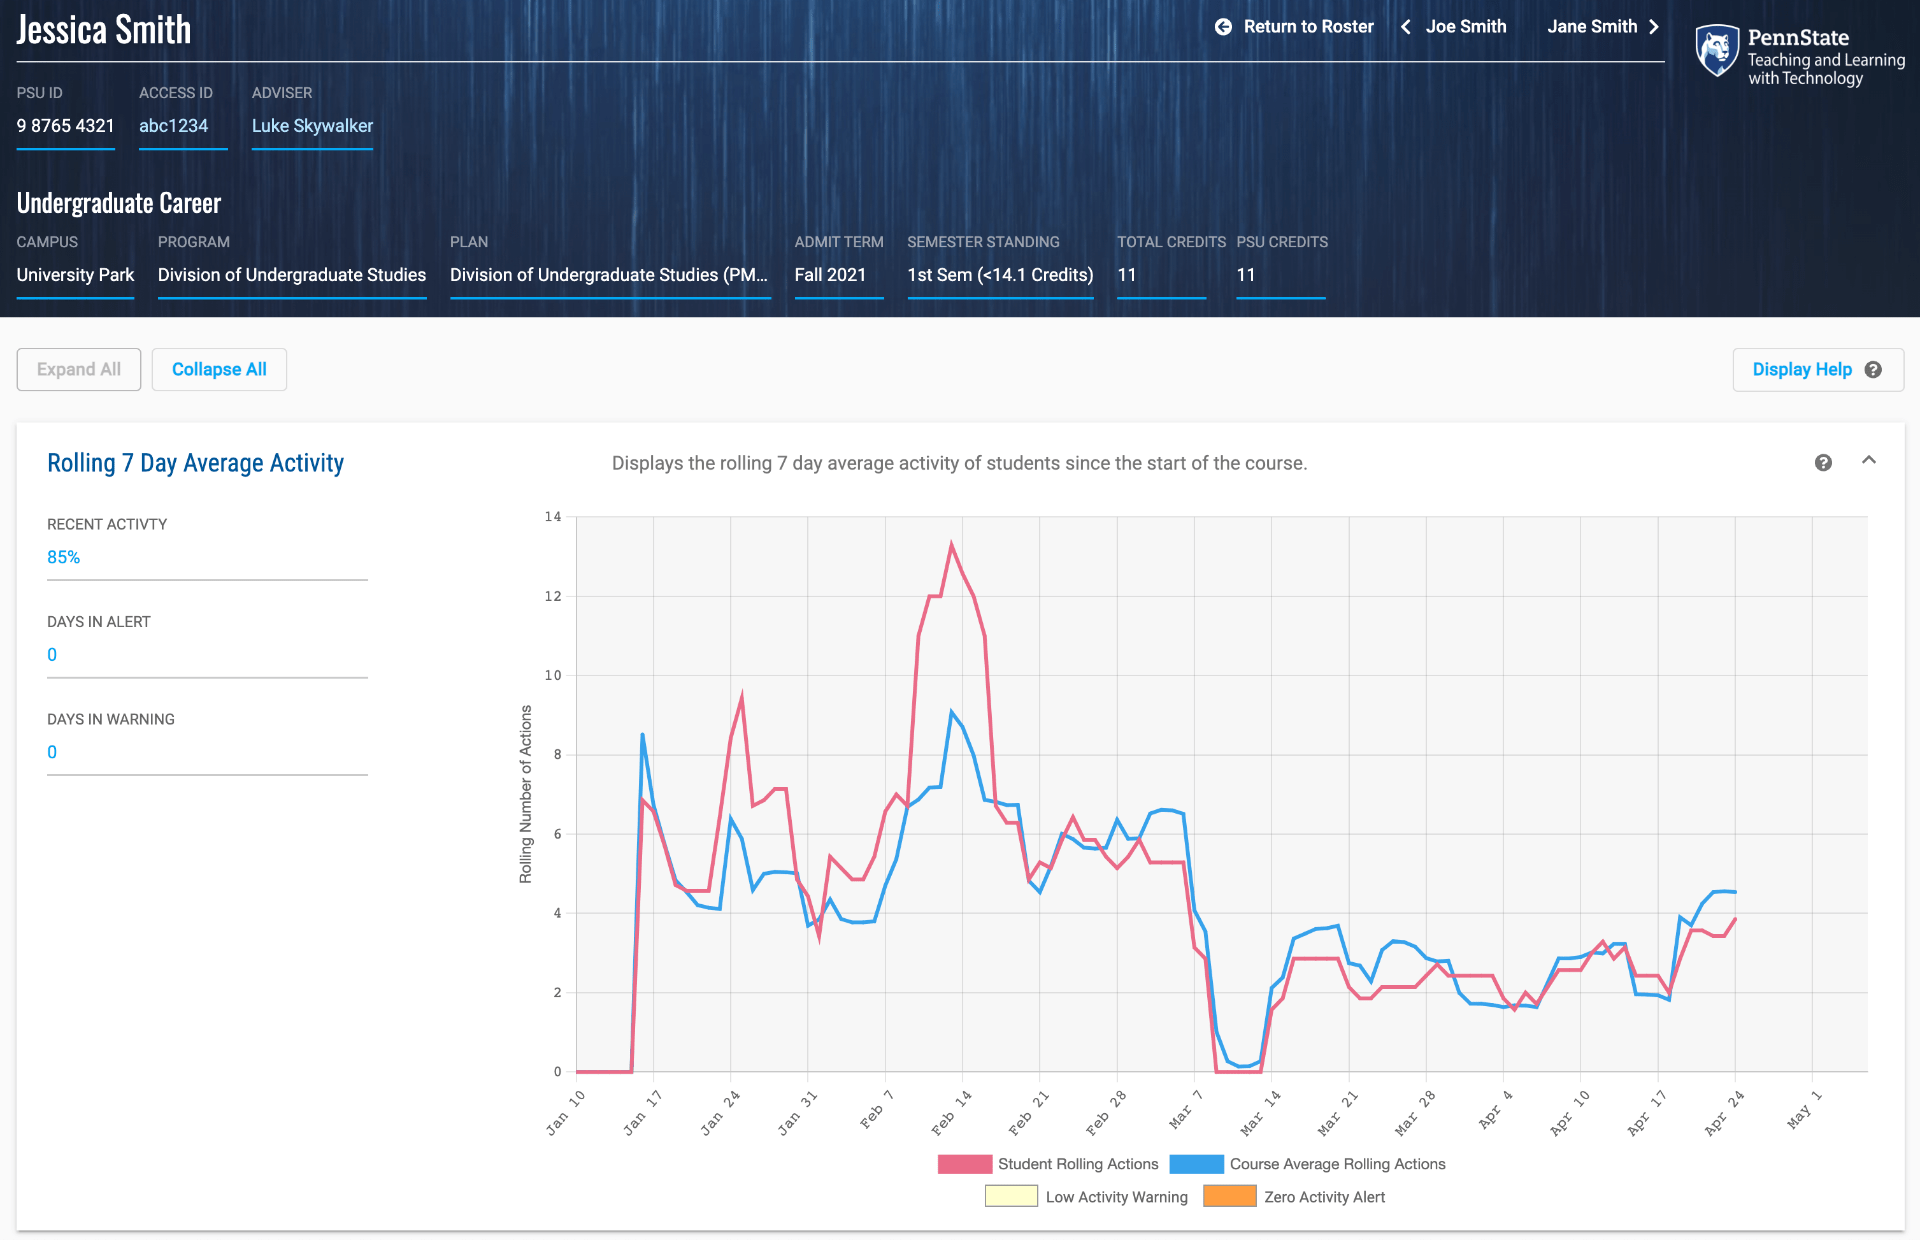
Any time a student performs a learning action, such as answering a quiz question or posting in a course discussion forum, they generate a digital footprint, an event log of their activity in the tool. Course Insights provides real-time visualization and dynamic alerting around low or zero online course activity to help identify struggling students.
Student Activity line graph

Impacting reflection for and on practice
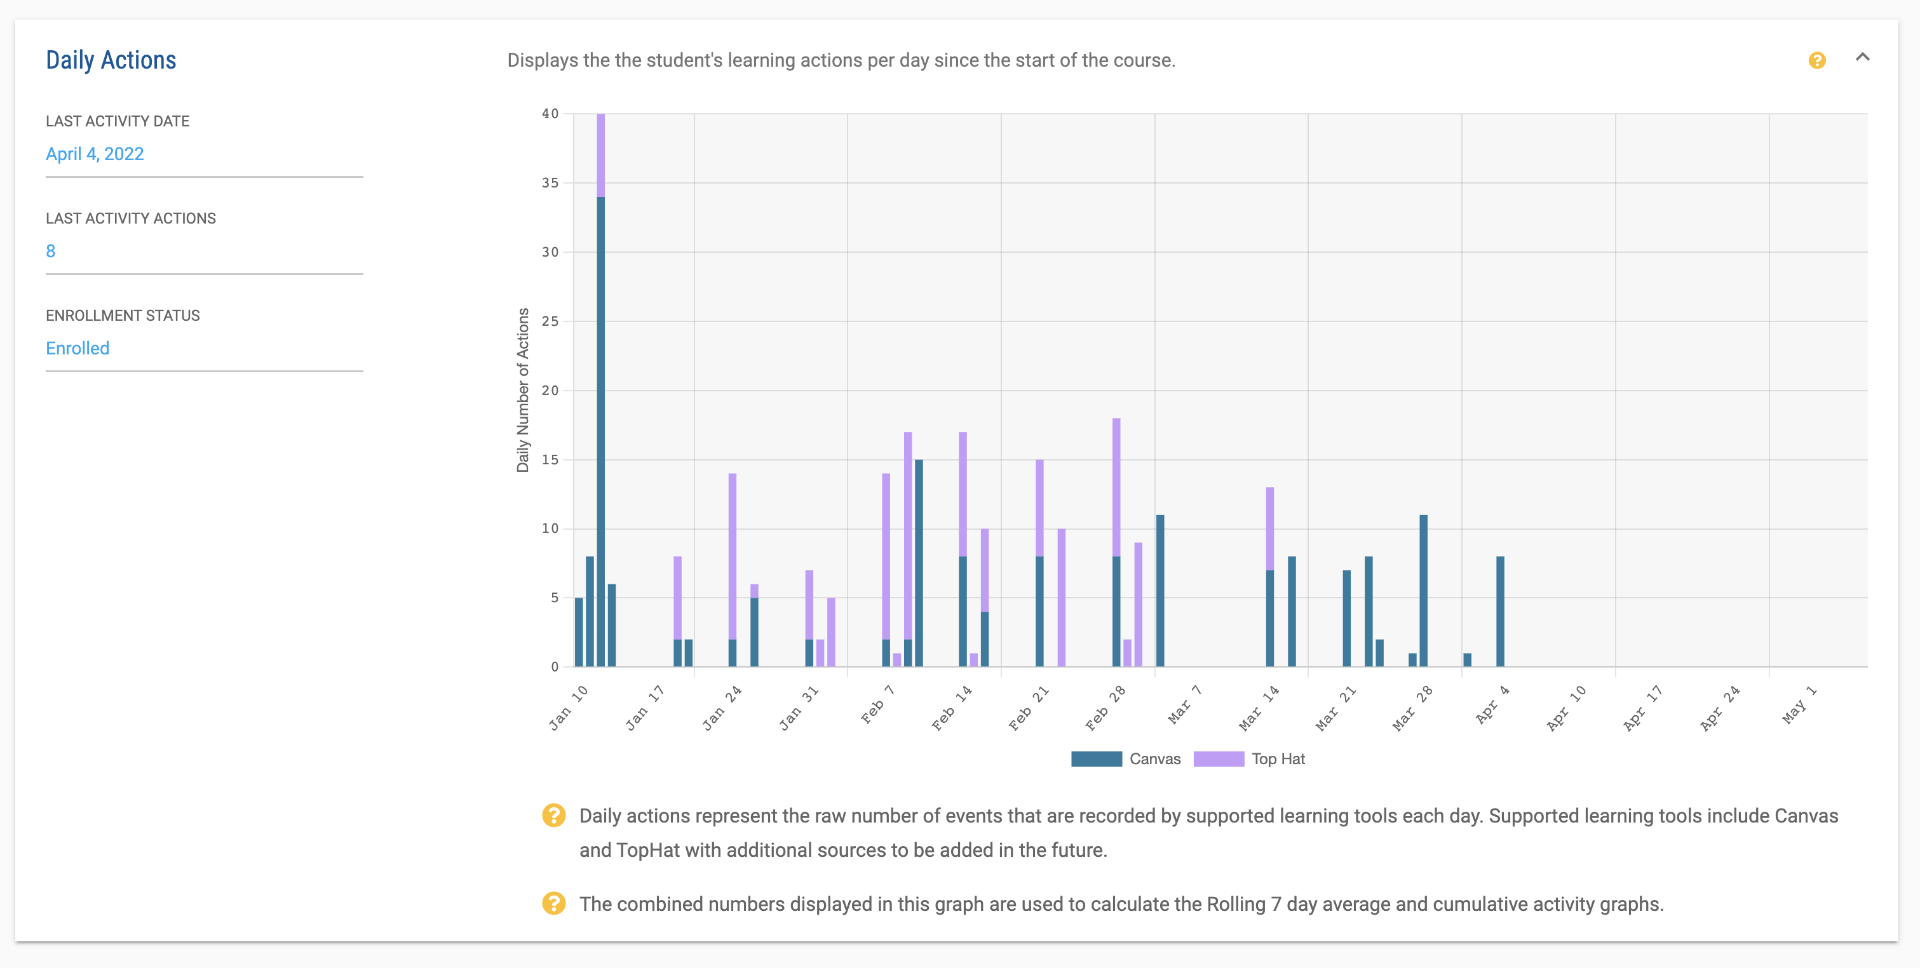
The power of Course Insights for instructors is in the tool’s ability to drive not only real-time intervention strategies with students who may be struggling in a course, but also in its ability to enable pedagogical improvements. Key demographic and learning pathway data brings instructors closer to the “real feel” of the students in their courses even before the first day of class. Histograms of incoming GPA curves, listings of prior enrollments, and gender and ethnicity data make it possible to plan and deliver course materials with the students in mind.
Daily Actions bar chart

Join the Pilot!

Instructors

Course Insights is currently available as a limited access pilot for instructors at Penn State.  Over 100 faculty from numerous Departments, Colleges, and Commonwealth Campuses are currently enrolled in the pilot.  If you are listed as the Instructor of record in LionPATH for a course and would like access to Course Insights, please email the Data Empowered Learning Team at delteam@psu.edu

Questions?

Have a great idea? Get in touch with us! We can help you identify the right technologies to meet your pedagogical needs, or develop something completely new.
Contact Us